
Press Release: PropertyGuru Reports Second Quarter 2022 Results
Revenues Grow 44% Year Over Year in Second Quarter and 43% in First Half
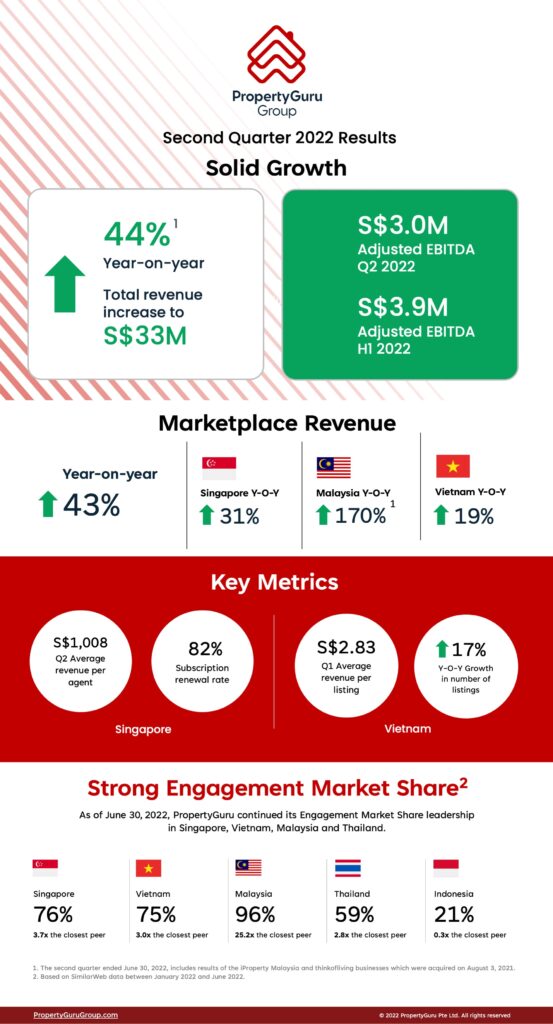
- Total revenue of S$33.0 million in the second quarter 2022 and S$61.3 million in the first half of 2022
- Adjusted EBITDA was S$3.0 million in the second quarter 2022 and S$3.9 million in the first half of 2022
Singapore – August 25, 2022 – PropertyGuru Group Limited (NYSE: PGRU) (“PropertyGuru” or the “Company”), Southeast Asia’s leading[4], property technology (“PropTech”) company, today announced financial results for the quarter ended June 30, 2022[5]. Net income and Adjusted EBITDA[6] were S$3.8 million and S$3.0 million, respectively, which compares to a net loss of S$139.8 million[7] and Adjusted EBITDA loss of S$2.0 million in the prior year period. Revenue of S$33.0 million in the second quarter 2022 increased 44% year over year.
Management Commentary
Hari V. Krishnan, Chief Executive Officer and Managing Director, PropertyGuru,said “Second quarter results built on the strong start to the year. The strategy of increasing our customer value proposition is proving effective, as we see the return on investments made over the past few years. The second quarter saw us deliver more tools and features that further enhance the customer experience as the pace of our internal innovation accelerates. Going forward, we expect to capitalize on both organic and inorganic opportunities to further expand our world-class solutions to customers. Even with our growing business strength, we remain vigilant around potential market challenges from rising inflation and interest rates and other global macro headwinds.”
Joe Dische, Chief Financial Officer, PropertyGuru, added “Second quarter revenues were up 44% year over year, building on the first quarter’s solid performance and setting us up for a strong back half of 2022. Growth was balanced across all business segments and the further leveraging of our cost structure helped drive positive Adjusted EBITDA.”
Financial Highlights – Second Quarter 2022
- Total revenue of S$33.0 million increased 44% year over year and was balanced with growth across all markets and business segments.
- Marketplaces revenues increased by 43% year over year to S$32.0 million. Investments made over the last two years are gaining traction now as real estate markets emerge from the pandemic-induced slowdown.
- Singapore Marketplaces revenue increased 31% to S$17.3 million. Quarterly Average Revenue Per Agent (“ARPA”) of S$1,008 rose 29% year over year through improved yield derived from previous price rises and increased activity on our platform. We had a total of 15,023 agents with a renewal rate of 82%, reflecting a strong local property market.
- Malaysia Marketplaces revenue increased 170% to S$5.9 million from S$2.2 million in the prior year period as a result of the acquisition of the iProperty business in August 2021.
- Vietnam Marketplaces revenue increased by 19% to S$6.9 million from S$5.8 million in the prior year period. This was driven by both a 17% increase in the number of listings to 2.38 million and a 7% increase in average revenue per listing (“ARPL”) to S$2.83.
- At quarter-end, cash and cash equivalents was $368.8 million.
Information regarding our operating segments is presented below.
| For the Three Months Ended June 30 | ||||||
| 2022 | 2021 | YoY Growth | ||||
| (S$ in thousands except percentages) | ||||||
| Revenue | 33,031 | 23,003 | 43.6% | |||
| Marketplaces | 32,001 | 22,328 | 43.3% | |||
| Singapore | 17,293 | 13,246 | 30.6% | |||
| Vietnam | 6,943 | 5,835 | 19.0% | |||
| Malaysia | 5,899 | 2,187 | 169.7% | |||
| Other Asia | 1,866 | 1,060 | 76.0% | |||
| Fintech and data services | 1,030 | 675 | 52.6% | |||
| Adjusted EBITDA | 3,011 | (1,950) | ||||
| Marketplaces | 12,964 | 6,805 | ||||
| Singapore | 11,233 | 8,601 | ||||
| Vietnam | 1,669 | 1,869 | ||||
| Malaysia | 1,241 | (2,439) | ||||
| Other Asia | (1,179) | (1,226) | ||||
| Fintech and data services | (1,885) | (1,351) | ||||
| Corporate* | (8,068) | (7,404) | ||||
| Adjusted EBITDA Margin (%) | 9.1% | -8.5% | ||||
| Marketplaces | 40.5% | 30.5% | ||||
| Singapore | 65.0% | 64.9% | ||||
| Vietnam | 24.0% | 32.0% | ||||
| Malaysia | 21.0% | -111.5% | ||||
| Other Asia | -63.2% | -115.7% | ||||
| Fintech and data services | -183.0% | -200.1% | ||||
| For the Six Months Ended June 30 | ||||||
| 2022 | 2021 | YoY Growth | ||||
| (S$ in thousands except percentages) | ||||||
| Revenue | 61,263 | 42,890 | 42.8% | |||
| Marketplaces | 59,214 | 41,537 | 42.6% | |||
| Singapore | 32,297 | 25,359 | 27.4% | |||
| Vietnam | 11,999 | 10,098 | 18.8% | |||
| Malaysia | 11,333 | 4,046 | 180.1% | |||
| Other Asia | 3,585 | 2,034 | 76.3% | |||
| Fintech and data services | 2,049 | 1,353 | 51.4% | |||
| Adjusted EBITDA | 3,895 | (4,772) | ||||
| Marketplaces | 26,616 | 10,884 | ||||
| Singapore | 22,631 | 16,932 | ||||
| Vietnam | 2,806 | 2,778 | ||||
| Malaysia | 3,610 | (6,931) | ||||
| Other Asia | (2,431) | (1,895) | ||||
| Fintech and data services | (3,531) | (2,093) | ||||
| Corporate* | (19,190) | (13,563) | ||||
| Adjusted EBITDA Margin (%) | 6.4% | -11.1% | ||||
| Marketplaces | 44.9% | 26.2% | ||||
| Singapore | 70.1% | 66.8% | ||||
| Vietnam | 23.4% | 27.5% | ||||
| Malaysia | 31.9% | -171.3% | ||||
| Other Asia | -67.8% | -93.2% | ||||
| Fintech and data services | -172.3% | -154.7% |
*Corporate consists of headquarters costs, which are not allocated to the segments. Headquarters costs are costs of PropertyGuru’s personnel that are based predominantly in its Singapore headquarters and certain key personnel in Malaysia and Thailand, and that service PropertyGuru’s group as a whole, consisting of its executive officers and its group marketing, technology, product, human resources, finance and operations teams, as well as platform IT costs (hosting, licensing, domain fees), workplace facilities costs, corporate public relations retainer costs and professional fees such as audit, legal and consultant fees. Certain elements of marketing expenses previously allocated to Corporate in the first quarter 2022 have since been moved to business segments in line with changes to internal reporting lines.
Strong Category Leadership Drives Long-Term Growth Opportunities
As of June 30, 2022, PropertyGuru continued its Engagement Market Share[8] leadership in Singapore, Vietnam, Malaysia and Thailand.
- Singapore: 76% – 3.7x the closest peer
- Vietnam: 75% – 3.0x the closest peer
- Malaysia: 96% – 25.2x the closest peer
- Thailand: 59% – 2.8x the closest peer
- Indonesia: 21% – 0.3x the closest peer
Full Year 2022 Outlook
The Company reiterates its full year 2022 outlook of approximately 44% revenue growth, driven by the strong start to 2022 and growth across all core markets. The Company expects to return to full year positive Adjusted EBITDA, as it realizes the full benefits of its pandemic-period investments in people, technology, and marketing. The Company cautions that this outlook could be impacted by uncertainty around rising inflation and interest rates, government policy and fiscal intervention, political instability, and other macro factors.
– End-
Property News Malaysia? Sign up for daily investment news updates (FREE since Nov 2013 and FOREVER). Alternatively, Follow me on Telegram here.
Please LIKE kopiandproperty.com FB page to get daily updates about the property market beyond kopiandproperty.com articles. Else, follow me on Twitter here.
Next suggested article: PropertyGuru Study: Affordability Issues Continue to Loom Over Potential Homebuyers as 51% of Respondents Feel That They Cannot Buy a Home Without Government Assistance